Overview
In this second open-ended programming project, you will perform some analyses on the survey data that we collected from you all last week.
Your project will need to satisfy many specifications, so before you begin programming be sure to read this project’s write-up in full.
Your task: using the functions from ex04 and the methods from the filtering lesson, perform a formal, end-to-end data analysis in a Jupyter Notebook.
Basic Steps
Step 1: Come up with a question you would like to explore.
Step 2: Outline the steps needed to test this hypothesis or investigate this question.
Step 3. Perform the data analysis
Step 4: Evaluate your findings. Was your prediction correct? What can you learn from your results? Do your findings present any new questiosn for a future exploration?
An Example
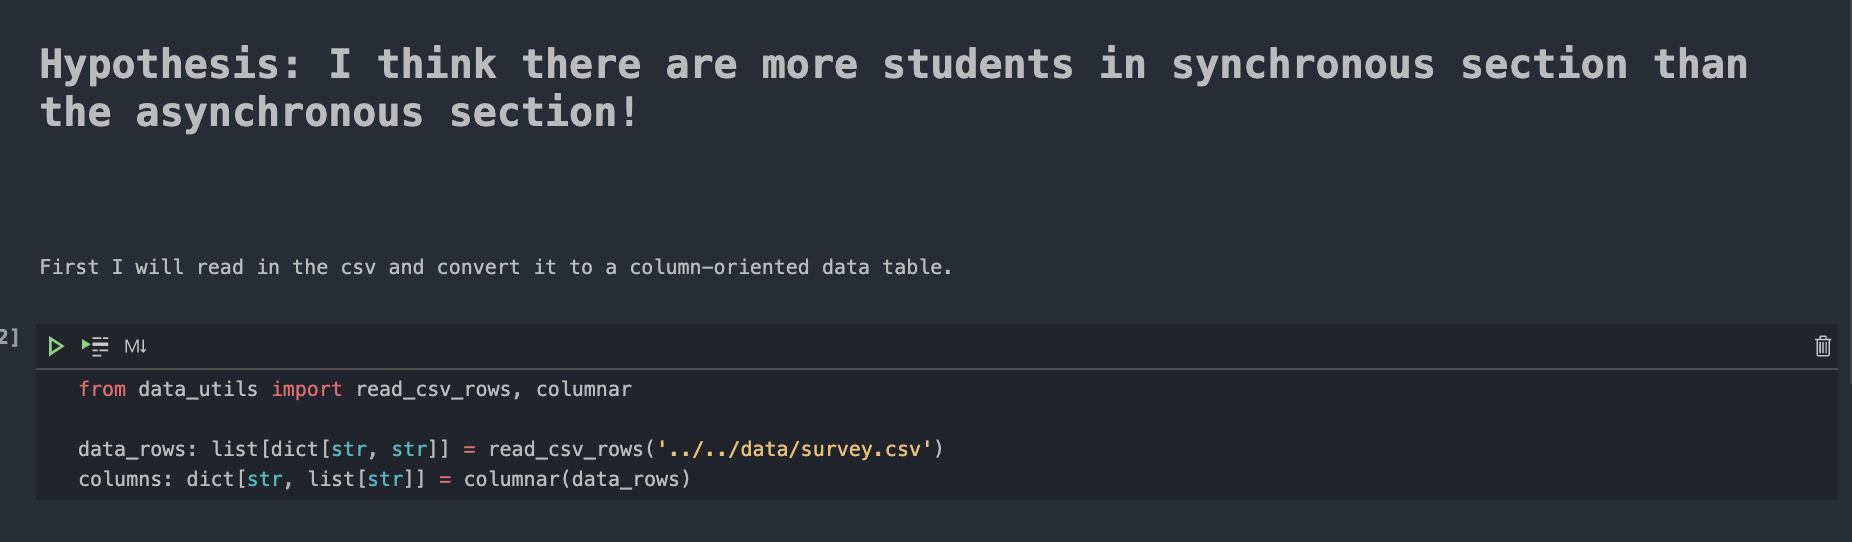
You are free to use your imagination to design and implement any experiment you would like, as long as it meets the requirements. For some inspiration, here is a basic analysis we’ve prepared as example of the format of we are looking for.
Some other questions that may be interesting to explore if you are running low on ideas:
- Are students who believe they will earn an A more likely to recommend the course in the Fall?
- Does it seem like the students in the synchronous section prefer live lectures?
- Are seniors more likely to complete lessons during the registered course time than first years?
Again, feel encouraged to come up with an idea that is uniquely your own! Your questions can be more elaborate. It would be especially interesting if there is something you’d like to see improved about the class and could pull together the data analysis to support it! This is the promise of data science: finding evidence-based improvements in the world around you.
Background Lessons
The conceptual purpose of the analysis is to help you practice the concepts you have learned up to this point and explore some additional, related topics, including:
- LS16/LS18 - Dictionaries and CSV Files
- LS17 - Jupyter Notebooks and Importing
- LS19 - Filtering Column-oriented Data
Getting Started
You will get the data needed by “pulling” from the course workspace repository. Steps to do this:
- Be sure you are in your course workspace. Open the file explorer and you should see your work for the course. If you do not, open your course workspace through File > Open Recent.
- Open the Source Control View by clicking the 3-node (circles) graph (connected by lines) icon in your sidebar or opening the command palatte and searching for Source Control.
- Click the Ellipses in the Source Control pane and select “Pull, Push” from the drop-down menu, then select “Pull from…” A box will appear and you should select either “origin” or “upstream”, but not “backup”. This will begin the pulling process from the course repository. It should silently succeed. (If you are on macOS and do not see anything in source control anymore, it may be because of a macOS update. You can typically resolve this by opening a new Terminal, typing the command
xcode-select --install, pressing enter and following its instructions. You will also need to restart VSCode after doing this.) - Return to the File Explorer pane and open the
datadirectory. You should see it now contains the csv file with the survey results calledsurvey.csv. - In your workspace’s
projectsdirectory, create a folder namedpj01. Inside that folder, create a file namedanalysis.ipynbfor this assignment. Additionally, create another filedata_utils.pyand copy in your functions fromex04.
Some notes before you begin
You will be working with a data set with many columns! We encourage you to play around with it and see what you find, but there is a guide at the bottom of this page for your reference.
Some notes:
- In order to make this dataset the most accessible for a course project, the team did some manual cleaning to get rid of any rough edges. So if you don’t see your custom answers reflected, that is not because we aren’t taking your feedback into account.
- Some of the questions were optional, so there will not be a data value for every column in every row. This is expected. Instead the value will just be the empty
stror"". - When you read in the CSV as a
list[dict[str, str]]with yourread_csv_rowsfunction, every value is interpreted as astr, including numerical ones! Analysis on columns that include likert data (ratings 1-7), for example, will need to be converted to a numeric type for numeric analysis. - You will want your first code cell in your notebook to include the following lines:
%reload_ext autoreload
%autoreload 2
Rubric
Reporting – 40 points
- 10 points - First markdown cell in your notebook states your hypothesis or question of interest
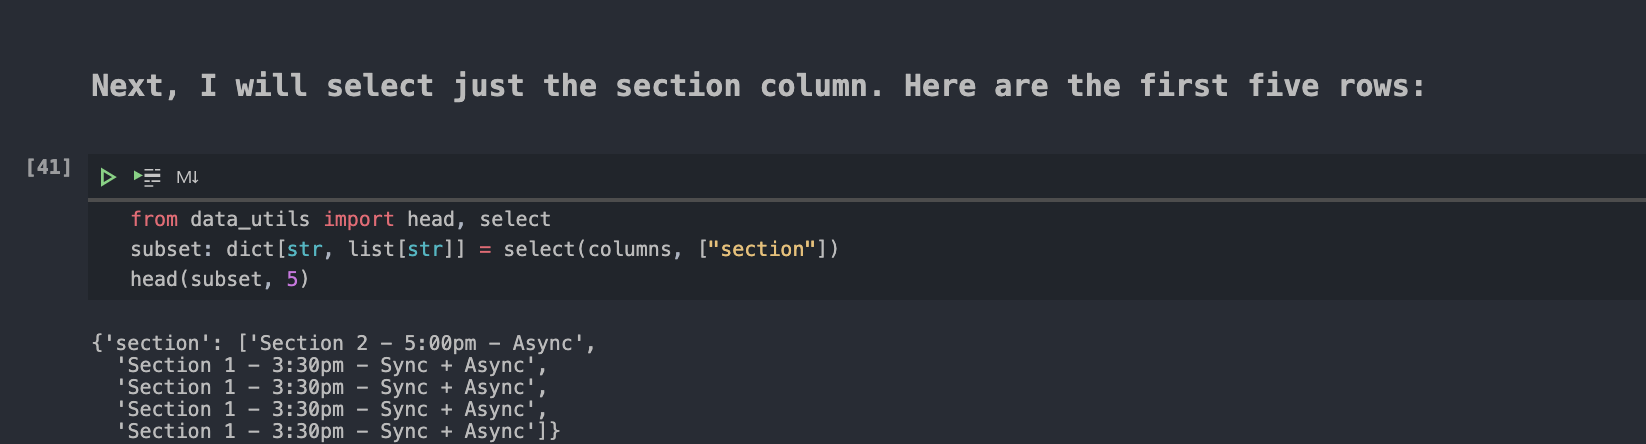
- 10 points - Each cell of code that you write must be preceeded by a markdown cell explaining what you are attempting to do. Walk us through your thought process.
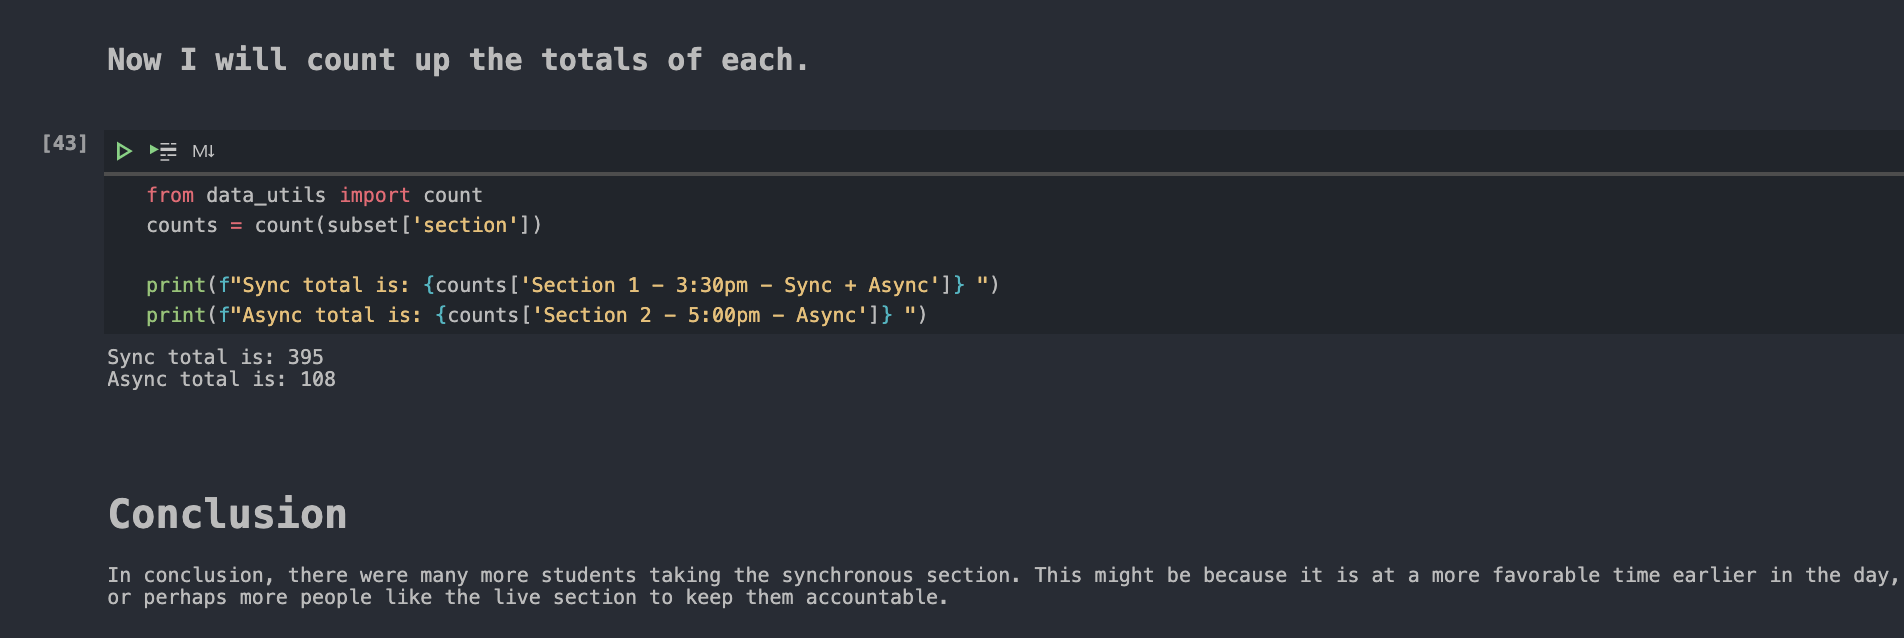
- 10 points - Final markdown cell is a conclusion paragraph summarizing your findings. Were you able to answer your question or prove your hypothesis? It is totally OK (and part of the process) to not get what you initially expected. You can still get full credit even if you end up contradicting your hypothesis :)
- 10 points - Above and beyond! Produce 2 visuals. Could be a data table or a plot. The libraries mentioned in this video are a good place to start! Feel free to explore what is out there. If you are producing plots and graphs, please be sure to label your axes and include a title. (Note: above and beyond points are included in the total score. If you choose not to do this, you can still earn 90% credit, which is an A)
Markdown tip! If you want to make something a big header, you can start the line with # for a big header, ## for a medium header, ### for a small one.
Analysis – 60 points
- 25 points - Import and make use of the
read_csv_rows,head,columnar,select,countfunctions from ex04. - 25 points - Define at least one function that produces a
maskbased on some criteria. Reminder: For our purposes, a mask is alist[bool]. To get credit for this requirement, it must be a different function than theless_thanone defined in this video. You are free to make use of theless_thanfunction in your analysis, but you’ll need to come up with at least one function of your own. - 10 points - Filter some data using this
mask.You are free to use themaskedfunction defined in class for this requirement.
These are just the baseline functionality requirements. In order to completely answer the question you pose, some more intermediate steps may be necessary!
Submission Instructions
Run python -m tools.submission projects/pj01 to build your submission zip for upload to Gradescope. Don’t forget to backup your work by creating a commit and pushing it to GitHub. For a reminder of this process, see the previous exercises.
All of the points for this project will be handgraded, so your autograder score should be 0/0. This blank screen is expected!
Tour of the Data
row_number – Row number! Unique for each row of the CSV.
year – Expected graduation year. Possible values: 21, 22, 23, 24. (Note: This is clearly a non-exhaustive list. Just simplified for the sake of the project)
unc_status – UNC status. Possible values: Returning UNC Student, Incoming Transfer Student, Incoming First-year Student
comp_major – Intention to major in CS. Possible values: Yes - BS, Yes - BA, Yes - Minor, No.
primary_major – Primary Major. Possible values: Advertising And Public Relations, Applied Mathematics, Art, Biology, Biostatistics, BME, Business, Chemistry, Chinese, Communications, Computer Science, Economics, English, Environmental Science, Exercise And Sport Science, Film, French, Geography, Geology, Health Policy And Management, History, Information Science, Journalism, Linguistics, Math, Music, Neuroscience, Nursing, Nutrition, Philosophy, Physics, Political Science, Psychology, Public Health, Sociology, Statistics, Undecided
prereqs – Prerequisites satisfied. Possible values are any combination of the following: MATH 129P, MATH 130, MATH 152, MATH 210, MATH 231, MATH 232, MATH 233, MATH 347, MATH 381, PHIL 155, PSYC 210, PSYC 215, STOR 112, STOR 113, STOR 120, STOR 151, STOR 155
prior_exp – Prior experience. Possible values: None to less than one month!, 2-6 months, 7-12 months, 1-2 years, Over 2 years
AP_Principles – Completed AP Computer Science Principles. Possible values: Yes, No
AP_A – Completed AP Computer Science A. Possible values: Yes, No
other_comp – Completed a different, formal programming class. Possible values: UNC, Another college or community college, High school course (IB or other), On-line course, Other, None
prior_time – Amount of time spent self-directed programming learning. Possible values: None to less than one month!, 1 month or so, 2-6 months, 7-12 months, 1-2 years, > 2 years
languages – Programming languages student can identify by reading w/o reference material. Possible values are any combination of the following: Python, Java / C#, C / C++, JavaScript / TypeScript, Go, LISP / Scheme / Racket, Haskell, R / Matlab / SAS, BASIC, HTML / CSS, SQL, Bash, Other
residency – In State or Out of State. Possible values: In-state, Out-of-state
on_campus – Living on or close to campus this year in Chapel Hill or Carboro. Possible values: Yes, No
international – Living in the US or international. Possible values: I am living in the United States, I am living Internationally
section – Enrollment section of COMP 110. Possible values: Section 1 - 3:30pm - Sync + Async, Section 2 - 5:00pm - Async
lesson_time – Student completes each lecture’s lessons during the hours of the day registered for the course. In other words, if in Section 1, lessons are completed between 3:30pm-4:45pm on Tu/Th, and if in Section 2, lessons are completed between 5pm-5:45pm on Tu/Th. Possible values (1 being Never and 7 being Always): 1, 2, 3, 4, 5, 6, 7
sync_perf – Student’s performance in this course would improve if every lecture were synchronous with required attendance during the regularly scheduled meeting time. Possible values (1 being Strongly Disagree and 7 being Strongly Agree): 1, 2, 3, 4, 5, 6, 7
all_sync – Student would prefer this course to require every lecture be synchronous with required attendance during the regularly scheduled meeting time. Possible values (1 being Strongly Disagree and 7 being Strongly Agree): 1, 2, 3, 4, 5, 6, 7
own_notes – Student keeps own notes for topics covered in lecture. Possible values (1 being Never and 7 being Always): 1, 2, 3, 4, 5, 6, 7
own_examples – When uncertain of how a concept works, student tries to come up with own examples in code. Possible values (1 being Never and 7 being Always): 1, 2, 3, 4, 5, 6, 7
oh_visits – On average, for a single programming exercise or project in this course, student typically needs to seek help in office hours about this many times. Possible values (0 being Zero and 5 being Five or More): 0, 1, 2, 3, 4, 5
ls_effective – Lesson videos are effective in helping student learn the topics of the course. Possible values (1 being Strongly Disagree and 7 being Strongly Agree): 1, 2, 3, 4, 5, 6, 7
lsqs_effective – Post-lesson questions on Gradescope are effective in helping student learn the topics of the course. Possible values (1 being Strongly Disagree and 7 being Strongly Agree): 1, 2, 3, 4, 5, 6, 7
programming_effective – Programming assignments are effective in helping student learn the topics of the course. Possible values (1 being Strongly Disagree and 7 being Strongly Agree): 1, 2, 3, 4, 5, 6, 7
qz_effective – Preparing for quizzes is effective in helping student learn the topics of the course. Possible values (1 being Strongly Disagree and 7 being Strongly Agree): 1, 2, 3, 4, 5, 6, 7
oh_effective – Office hours 1:1 appointments are effective in helping student learn the topics of the course. Possible values (1 being Strongly Disagree and 7 being Strongly Agree, Empty string if student has not attended OH): 1, 2, 3, 4, 5, 6, 7, ""
tutoring_effective – Tutoring is effective in helping student learn the topics of the course. Possible values (1 being Strongly Disagree and 7 being Strongly Agree, Empty string if student has not attended tutoring): 1, 2, 3, 4, 5, 6, 7, ""
kaki_effective – Kaki’s review sessions are effective in helping student learn the topics of the course. Possible values (1 being Strongly Disagree and 7 being Strongly Agree, Empty string if student has not attended Kaki’s review sessions): 1, 2, 3, 4, 5, 6, 7, ""
pace – Student finds the pace of COMP110 to be moving… Possible values (1 being Very Slowly and 7 being Very Quickly): 1, 2, 3, 4, 5, 6, 7
difficulty – Student is finding COMP110 to be… Possible values (1 being Very Easy and 7 being Very Difficult): 1, 2, 3, 4, 5, 6, 7
understanding – So far, student is feeling like they typically… Possible values (1 being Are Lost and 7 being Understand Everything): 1, 2, 3, 4, 5, 6, 7
interested – Student believes the topics they are learning in this course are intellectually interesting. Possible values (1 being Strongly Disagree and 7 being Strongly Agree): 1, 2, 3, 4, 5, 6, 7
valuable – Student believes the skills they are learning in this course will be valuable to them in the future. Possible values (1 being Strongly Disagree and 7 being Strongly Agree): 1, 2, 3, 4, 5, 6, 7
grade – Student’s expected course grade. Possible values: A, B, C, D, F
would_recommend – Student would recommend this course to other students in the Fall. Possible values (1 being Strongly Disagree and 7 being Strongly Agree): 1, 2, 3, 4, 5, 6, 7